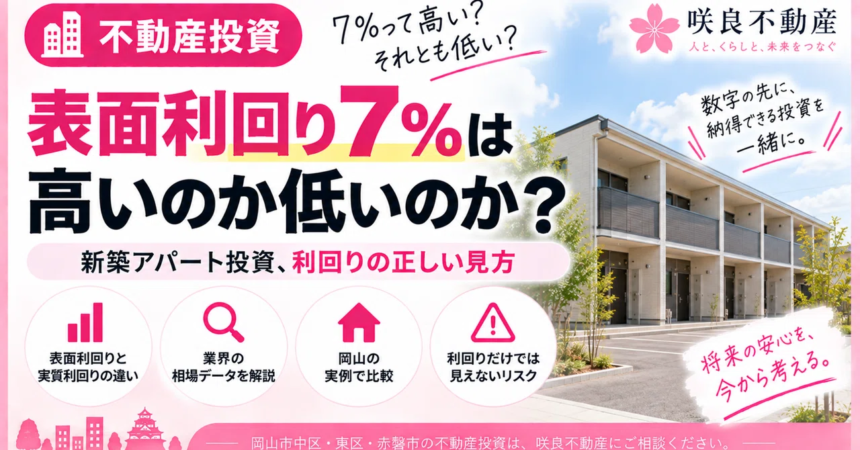
I am Hatanaka, and I run a real estate company in Okayama Prefecture.
“The gross yield is 7%.”
When you hear that, do you honestly have no idea whether it is high or low?
Don’t you have that feeling?
Whenever the topic of real estate investment comes up, the figure of “X% yield” almost always comes up first.
However, it is actually dangerous to judge whether something is a “good deal” or “overpriced” based on that number alone.
Up until now, I have mainly talked about selling, buying, and inheriting your own home in this note.
Starting with this post, I would like to write about the theme of “real estate investment” as well.
I am still accepting consultations regarding the buying, selling, and inheritance of your home as before.
In addition, I plan to gradually share information about real estate investment for the purpose of asset formation.
The theme of the first installment is how to view “yield,” which is where many people stumble at the beginning.
“I don’t know if the yield figure is truly reliable.”
“I’m worried about failing due to the assumption that high yield equals a good deal.”
“New construction looks expensive, and I have psychological resistance to it.”
“I don’t know if I should take the real estate company’s explanation at face value.”
I have heard these concerns from many people so far.
I understand those feelings well.
Today, I will talk in order about the difference between gross yield and net yield, how to correctly read industry market data, actual examples within Okayama Prefecture, and risks that cannot be seen from yield alone.
■ What is “gross yield” in the first place?
First, let’s confirm the basics.
The gross yield is calculated using the following formula.
Annual rental income ÷ Property price × 100
It is a very simple formula, isn’t it?
Almost all the “yields of X%” listed on real estate portal sites and in advertisements are this gross yield.
However, this figure does not deduct any expenses such as management fees or taxes.
That is where the net yield comes into play.
The net yield is calculated as follows.
(Annual rental income − Annual operating expenses) ÷ (Property price + Purchase costs) × 100
Management fees, repair costs, property taxes and city planning taxes, fire insurance premiums, and losses during periods when rent is not received due to vacancies.
This is a figure based on what you actually take home, so to speak, after deducting these items.
Let’s look at a concrete example.
Suppose you have a property worth 30 million yen with an annual rental income of 1.2 million yen.
In this case, the gross yield is 4%.
There is an estimation example where, after deducting expenses such as management fees and taxes from this, the net yield drops to approximately 3.1%.
Even for the same property, the figure changes by nearly one percentage point depending on the indicator you look at.
Just because the gross yield is high does not necessarily mean it is an immediate bargain.
I would like you to keep this premise in mind first.
■ The reason why you cannot definitively say “the market rate is X%”
Next, let’s look at the market figures.
I would like to state beforehand that it is actually impossible to say in one word that “the industry market rate is X%”.
I will explain the reasons in order.
First, as a rule of thumb commonly seen in multiple real estate investment media, it is stated that “for new apartments, a gross yield of 5-9% and a net yield of about 3-6% are the benchmarks.”
I will be honest and state that this is merely a benchmark based on experience and does not have official statistical backing.
Next, let’s look at the actual sales data from major industry portals.
According to the Kenbiya “Income Property Market Trends Monthly Report,” the average gross yield for apartment buildings for the January-March 2026 period is as follows.
Nationwide 8.06% (average price 90.27 million yen)
Tokyo and three surrounding prefectures 6.89% (average price 102.63 million yen)
Tokyo 23 wards 5.65% (average price 143.25 million yen)
You can see a trend where yields become lower as you get closer to urban areas.
On the other hand, looking at the statistics from Rakumachi Shimbun, another major industry portal, figures in the 9-10% range appear for around the same period in 2025, which is a higher level than Kenbiya.
Even for the same “apartment building yield,” the figures differ by 1-2 points depending on the portal doing the aggregation.
This is thought to be due to differences in the properties and regional composition being aggregated, but the detailed reasons cannot be determined.
That is precisely why the honest truth is that it cannot be stated in a single word that “the industry market price is X%.”
There is one more important point to note.
Both Kenbiya and Rakumachi data are the “price/yield at the time of listing” displayed at the time of sale.
They are not figures based on the price actually contracted, nor are they net yields after deducting expenses.
This is a point I would like you not to confuse.
■ Looking at an actual example in Okayama Prefecture
Up to this point, the discussion has been about nationwide and urban areas.
So, how is it within Okayama Prefecture?
Looking at income properties in Okayama Prefecture listed on Kenbiya, it is clear that yields vary widely, ranging from 4.66% to 22.78%.
This information was checked based on site listings as of September 2026 and is strictly for reference, as it fluctuates over time.
The trend follows the national pattern: ‘the older the building, the higher the yield, and the newer the property, the lower the yield.’
Here are a few specific examples.
Minami-ku, Okayama City, low 300 million yen range, built in 2016, 4.66% yield
Kita-ku, Okayama City, low 100 million yen range, built in 1989, approximately 11-12% yield (multiple properties with similar conditions were observed)
Minami-ku, Okayama City, 70 million yen range, built in 1973, 22.78% yield (this is an outlier example of an old building)
When lined up like this, it is clear that newer properties tend to have more modest yields, while older properties tend to have higher yields.
With that in mind, let’s place the new wooden apartments we broker (price range 100-300 million yen, gross yield around 7%) into this lineup.
Compared to examples of new properties in Okayama Prefecture (in the 4% range), this is at a slightly higher level.
It is also a figure that sits somewhere between the ‘Tokyo metropolitan area level (6.89%)’ and the ‘national average level (around 8%)’ seen in Kenbiya’s national data.
However, while it is a fact that the gross yield is at a certain level, this does not necessarily translate directly into net yield or future income and expenditure. It is a figure that should be viewed strictly as one piece of judgment material.
I have seen both cases: consultations where people rushed into contracts looking only at the yield figures and ended up thinking ‘this isn’t what I expected,’ and conversely, people who have earned stable income for a long time even with modest figures.
The numbers are the starting line, not the finish line.
■ Touching on risks that cannot be seen from yield alone
Even if you can read the yield figures correctly, that does not complete the judgment process.
From here, I will talk about risk factors that you should also look at.
○ Regarding vacancy risk
According to the Ministry of Internal Affairs and Communications’ ‘Housing and Land Survey’ (2023 final figures), the national vacancy rate reached a record high of 13.8%.
However, this figure is the ‘vacancy rate’ which includes all properties for rent, sale, vacation homes, etc., and the definition differs from the vacancy rate of rental apartments themselves.
You need to be careful not to confuse these.
As for the vacancy rate of rental properties in Okayama City, you may see information from proprietary industry surveys stating an “occupancy rate of 84.4%” or that “there are differences depending on the administrative district.”
However, this information is not backed by primary statistics.
In this article, we will not treat these as definitive figures, and we recommend that you view them with the understanding that “there are differences depending on the area.”
○ Regarding the useful life and loan term for wooden structures
The statutory useful life of a wooden apartment is 22 years (based on National Tax Agency standards).
Many financial institutions tend to use this useful life as a guideline for loan terms.
While new construction may allow you to utilize the useful life for a loan term close to the full duration, for used properties, the shorter the remaining useful life, the more likely loan conditions are to become stricter.
○ Regarding risks of repairs and interest rate hikes
New construction requires fewer initial repair costs, but future large-scale repair costs vary depending on the scale and specifications of the property.
Also, if interest rates rise, the repayment burden will increase accordingly.
You need to look at the balance of payments, including interest rates and repair plans, not just the yield figures.
○ Regarding rent guarantees and sub-leasing
Rather than simply thinking, “It’s safe because there’s a rent guarantee,” you need to check the contract details individually, such as the scope of the guarantee, the exemption period, and the possibility of future revisions to the guaranteed rent.
Our position is strictly that of an “intermediary.”
We are in a position to introduce properties and support transactions, and while we provide neutral information regarding the pros and cons of rent guarantees and sub-leasing tailored to your individual circumstances, we do not say, “You absolutely should do this.”
■ Summary
Let’s look back at what we covered today.
The “X% yield” listed in real estate advertisements is almost always the gross yield, and the figure differs from the net yield after deducting expenses.
Even between industry-leading portals like Kenbiya and Rakumachi, yield figures differ by 1 to 2 points, and it is impossible to state definitively that “the industry average is X%.”
The yield level (around 7%) of new apartments brokered by Sakura is slightly higher than examples of new properties in Okayama Prefecture, and sits between the levels of the Tokyo metropolitan area and the national average, but this is merely one factor for consideration.
Furthermore, there are factors beyond yield that must be examined, such as vacancy risk, the useful life of wooden structures versus loan terms, and risks related to repairs and interest rate hikes.
Yield figures are the starting point for evaluation, not the answer itself.
Rather than rushing to decide based solely on numbers, I would like you to check the details behind those numbers according to your own situation before making a judgment.
Regarding the topic of real estate investment, I plan to continue writing about questions I frequently receive during consultations, such as ‘The differences between new and used, wooden and RC structures, and major house builders versus local contractors’ and ‘What it means to start an apartment business in Okayama City’.
If you are interested in how to choose the property itself (structure and construction company), please also take a look at the next article, ‘Why New x Wooden x Local Contractor?’
If you are interested in specific property yield simulations or information on new apartments in Okayama, please feel free to consult with us via our official LINE or website.
Thank you for reading until the end.
Official LINE: https://lin.ee/zl6kclX
Sakura Real Estate Official Website: https://sakura-shoji.com/cms/
#RealEstateInvestment #ApartmentManagement #Yield #NewApartment #SakuraRealEstate