SA3 regions where property prices boomed in the June 2026 quarter
| State | SA3 | Property | June-26 | Mar-26 | Quarterly change | Jun-26 vs Mar-26 difference |
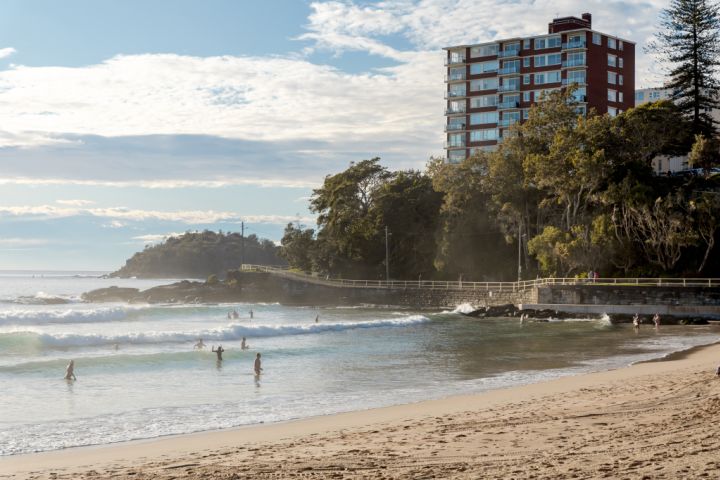
| NSW | Manly | Unit | $2,000,000 | $1,800,000 | 11.1% | $200,000 |
| South Australia | Adelaide City | House | $1,207,500 | $1,105,000 | 9.3% | $102,500 |
| NSW | Eastern Suburbs – South | House | $3,300,000 | $3,200,000 | 3.1% | $100,000 |
| South Australia | Playford | House | $620,000 | $530,000 | 17.0% | $90,000 |
| South Australia | Mitcham | House | $1,400,000 | $1,318,250 | 6.2% | $81,750 |
| NSW | Leichhardt | Unit | $1,080,000 | $1,000,000 | 8.0% | $80,000 |
| Queensland | Noosa Hinterland | House | $1,480,000 | $1,400,000 | 5.7% | $80,000 |
| Queensland | Caboolture | Unit | $682,500 | $605,000 | 12.8% | $77,500 |
| Queensland | Nambour | House | $1,137,500 | $1,065,000 | 6.8% | $72,500 |
| Western Australia | Albany | House | $820,000 | $752,000 | 9.0% | $68,000 |
Domain House Price Report, June 2026

“Places where prices have risen most in dollar terms generally fall into two main groups,” Domain chief residential economist Dr Nicola Powell says. “That’s the prestige lifestyle markets in Sydney and the more affordable, value-driven markets.